Cepton Viewer User Guide
Introduction
Thank you for choosing Cepton. Led by industry veterans with deep experience in lidar and advanced imaging, we aim to provide top-quality, cost-effective lidar solutions for the automotive, security, transport infrastructure, industrial, IoT and mapping markets. The CeptonViewer tool enables you to quickly connect to the sensor and visualize the point cloud. Powered by our patented Micro Motion Technology (MMT®), this state-or-the-art lidar sensor features a unique scan pattern to deliver dense and uniformly distributed point cloud for long-range and high-resolution 3D sensing. Enough advertising - let's get started!
Download and Install CeptonViewer
Download the CeptonViewer by going to https://developer.cepton.com/viewer, and download the latest viewer for your system. CeptonViewer is available for Windows and Linux (Ubuntu 18 or higher).
Installation of CeptonViewer is fast and without any user interaction. CeptonViewer will launch immediately after installation is complete.
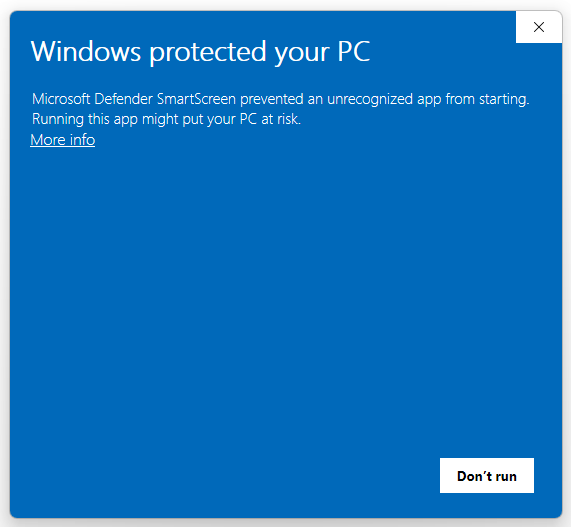
In Windows environment, if you see a blue OS dialog for application certificate, please click More Info and then click Run Anyway. We will have proper application certificates for Windows in future versions of CeptonViewer.
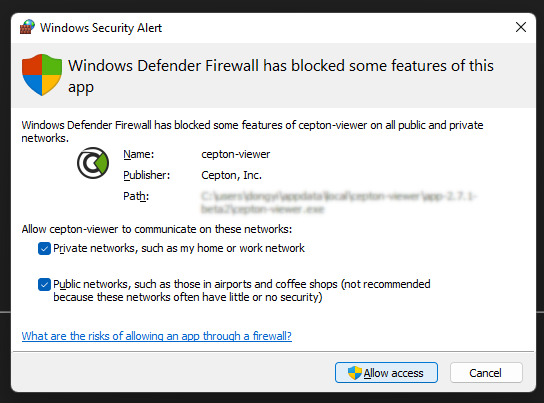
On Windows operating systems, when you run CeptonViewer for the very first time, there will be a windows firewall popup. Please make sure you check both the private and public network before clicking Allow access.
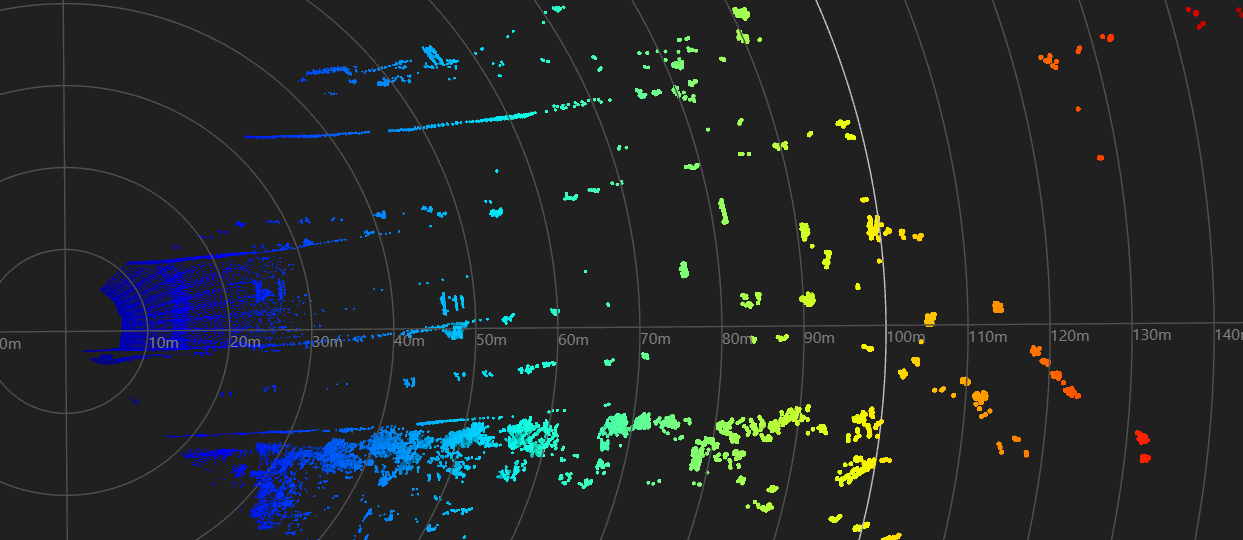
Visualizing the Point Cloud
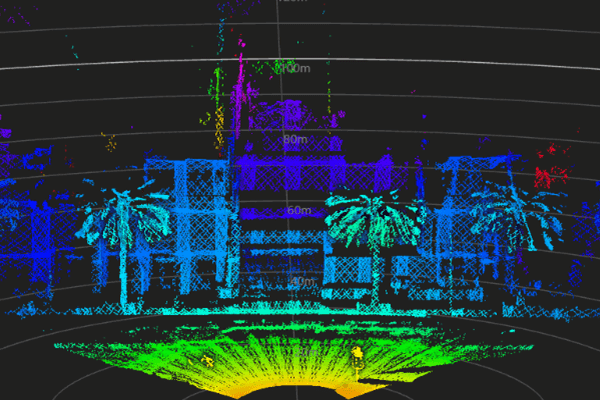
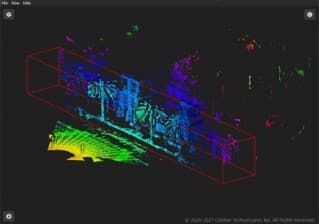
Once you have connected to and powered on your sensor, you should be able to visualize the point cloud instantly. When navigating the viewer window, hold down the right mouse button to maneuver the capture on one axis, and hold down the left mouse button to rotate the capture around the origin.
Shortcut commands
| Command | Shortcuts |
|---|---|
| Pause/Resume | Space Bar |
| Front View | 1 |
| Top-Down View | 2 |
| Side View | 3 |
| Reset Translation | 0 |
| Load Replay | Ctrl+O |
| Record to PCAP | Ctrl+Shift+P |
| Screenshot | Ctrl+Shift+S |
| Toggle Image View | Ctrl+I |
| Toggle Ground Grid | Ctrl+G |
Point Cloud Display Configurations
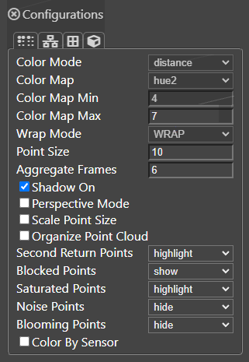
The Configurations Menu has four tabs: PCL, Net, Bounds, and View. The first tab in the Configurations Menu is the PCL tab where you will be able to configure how you want the point cloud to be displayed.
| Color Mode | Change the colorization of the point cloud by Z, Y, Distance, Reflectivity, or Channel. |
| Color Map | Color Scheme by Grayscale, Hue, Constant, Jet, Hot, Sequential, or Diverging. |
| Min & Max | Adjustable color scale for the Color Map |
| Wrap Mode | Optional coloring sequence in Clamp, Mirror, and Wrap. |
| Wrap Mode: Clamp | The color mode is applied between the bounds of the color map, and the remaining points are smeared with the color of edge pixels. |
| Wrap Mode: Mirror | The color mode is mirrored at the bounds of the min and max values of the color map. |
| Wrap Mode: Wrap | The color mode is repeated at the bounds of the min and max values of the color map. |
| Point Size | Increase or decrease size of points. |
| Aggregate Frames | Increase or decrease the number of frames displayed. |
| Shadow On | Add simulated shadows to point cloud for improved depth perception |
| Perspective Mode | Point cloud view from the perspective of the sensor |
| Scale Point Size | Dynamically scale point size in point cloud |
| Organize Point Cloud | Point cloud view without the MMT pattern |
| Saturated Points | Toggle visualization of saturated points (Saturated Points refers to the points with a very high SN ratio and the detection algorithm is not accurate enough to detect the peak) |
| Second Return Points | Toggle visualization of second return points (Second Return Points refers to the points with the last detectable signal if not the strongest; if not, it is the point with the second strongest detectable signal) |
| Blocked Points | Toggle the highlighting of blocked points |
| Noise Points | Toggle the visualization of noise points |
| Blooming Points | Toggle the visualization of blooming points |
| Color By Sensor | Color-code points from multiple sensors |
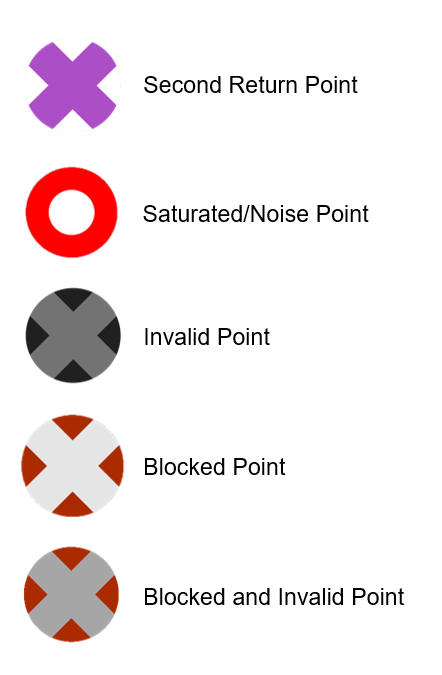
When points are set to highlight, they will be displayed according to the legend below.
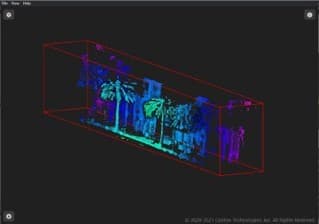
The third tab in the Configuration Menu is the Configurations Bounds Menu. Here you can adjust the limits along x, y and z directions, as well as the reflectivity to render a specified area of the point cloud.
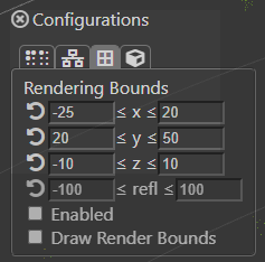
Once you have adjusted the rendering bounds, check the Draw Render Bounds box to preview the Render Bounds Box. Points within the box will be rendered, and points outside of the box will not be rendered.
Click Enable to apply the box rendering bounds.
The fourth tab in the Configurations Menu is the Configurations View Menu which is used for point cloud transformations. Here you can adjust the Yaw, Pitch, Roll, X, Y, and Z values of a single sensor's point cloud about the origin.
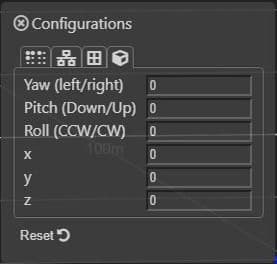
| Yaw | Rotates the point cloud in degrees about the z direction of the sensor |
| Pitch | Rotates the point cloud in degrees about the x direction of the sensor |
| Roll | Roatates the point cloud in degrees about the y direction of the sensor |
| X | Offsets the point cloud by meters in the x direction |
| Y | Offsets the point cloud by meters in the y direction |
| Z | Offsets the point cloud by meters in the z direction |
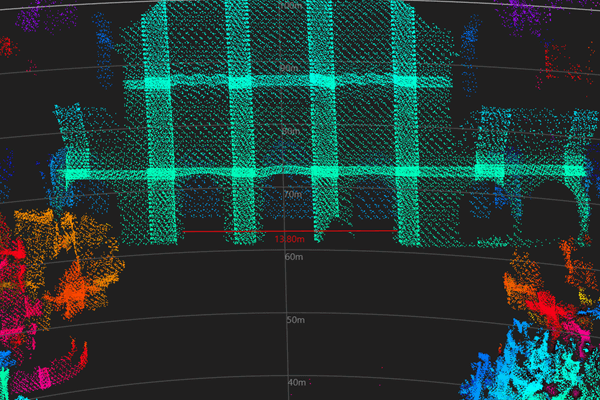
Use Ruler Tool
The Ruler Tool enables you to measure the distance from point to point. To use this feature, select View on the menu bar and select Show Ruler Control. This will enable the Ruler toggle button. To take a measurement, hold the Ctrl button, press and hold the Left Click button of the mouse and drag it from one point to another.
Record, Replay, and Convert Data
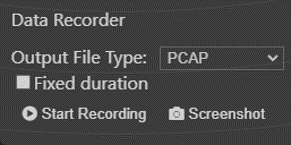
Recording data using the Data Recorder window will record the point cloud in PCAP or CSV format. To record, click View on the top menu bar and select Show Capture Window.Select your desired format from the Output File Type dropdown menu. The Data Recorder window allows for indefinite recording as well as recording for a defined number of seconds.
Sensor Info
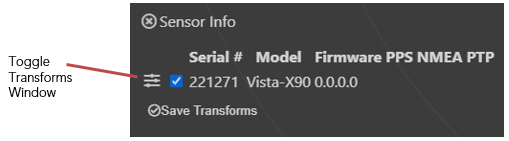
The Sensor Info tool displays the Serial Number, Sensor Model, and Firmware version of the sensor that is connected/the sensor with which the PCAP was recorded. To use this feature, select Viewon the menu bar and select Show Sensor Info. You can also access the Tranforms window by clicking the toggle button within the Sensor Info window.
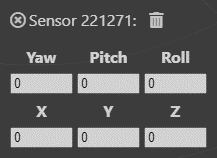
Transforms Window
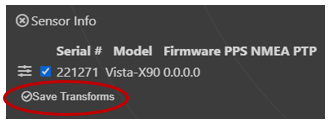
Use the transforms window to adjust and align multiple sensors. Your custom configuration can be saved for other applications by clicking the Save Transforms button in the Sensor Info Window. Use File - Load Transforms to access your saved transforms.
Point Selector
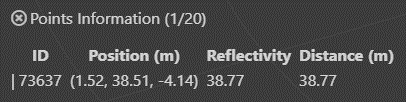
Use the Point Selector tool to recieve ID, position in x, y, and z values, reflectivity, and distance data for a specific point in the point cloud. The measurement of position and distance is in meters. Reflectivity is displayed as a percentage. The Point Selector will only display reflectivity values when color mode is set to reflectivity in the PCL tab of the Configurations menu. Please note that the Point Selector is only available in paused PCAP recordings and when the Ruler Tool is toggled off. To use the Point Selector, hold Shift and use the left mouse button to click on the point you are interested in. Below is an example of what the Points Information window will look like.
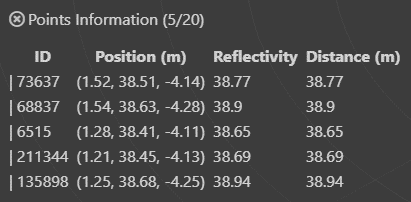
The Point Selector allows the selection of up to 20 points simultaneously. Below is an example of what the Points Information Window looks like when multiple points are selected.
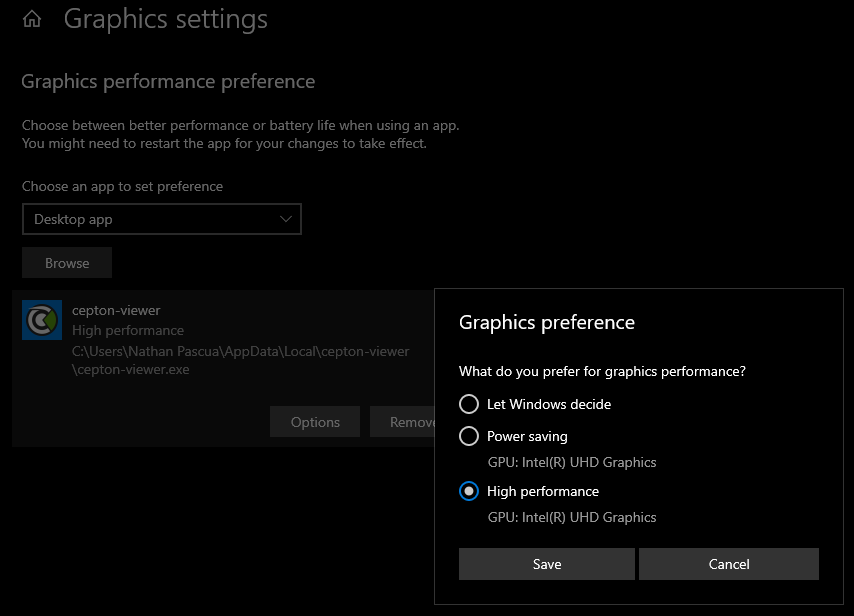
Graphics Settings
Depending on your computer and its settings, the point cloud on the CeptonViewer may flash in and out as if some packets were dropped. To eliminate your computer as a possible issue, we reccomend changing the graphics settings to allow your CeptonViewer to work at the highest performance.
- Go to the search bar on your computer and type Graphics Settings.
- From the Graphics Settings menu, press Browse button and find the Cepton Viewer application on your machine. Click add.
- Scroll to the CeptonViewer application and click the Options button
- Select the High Performance option
- Click Save to save your changes.