Pedestrian Classification
Introduction:
Given the chaotic and unpredictable nature of roads, cars must always be aware of where pedestrians are. Conventional cameras often find this task difficult, due to variations in occlusions and lighting conditions in the real world. LIDAR, however, does not have these issues, motivating a new approach towards pedestrian classification.
This blog goes over our dataset, the PointNet model, and the slight modifications to the architecture we used to achieve over 98% test accuracy.
Methods:
 |
|---|
| Figure 1. Full Model Diagram |
Dataset
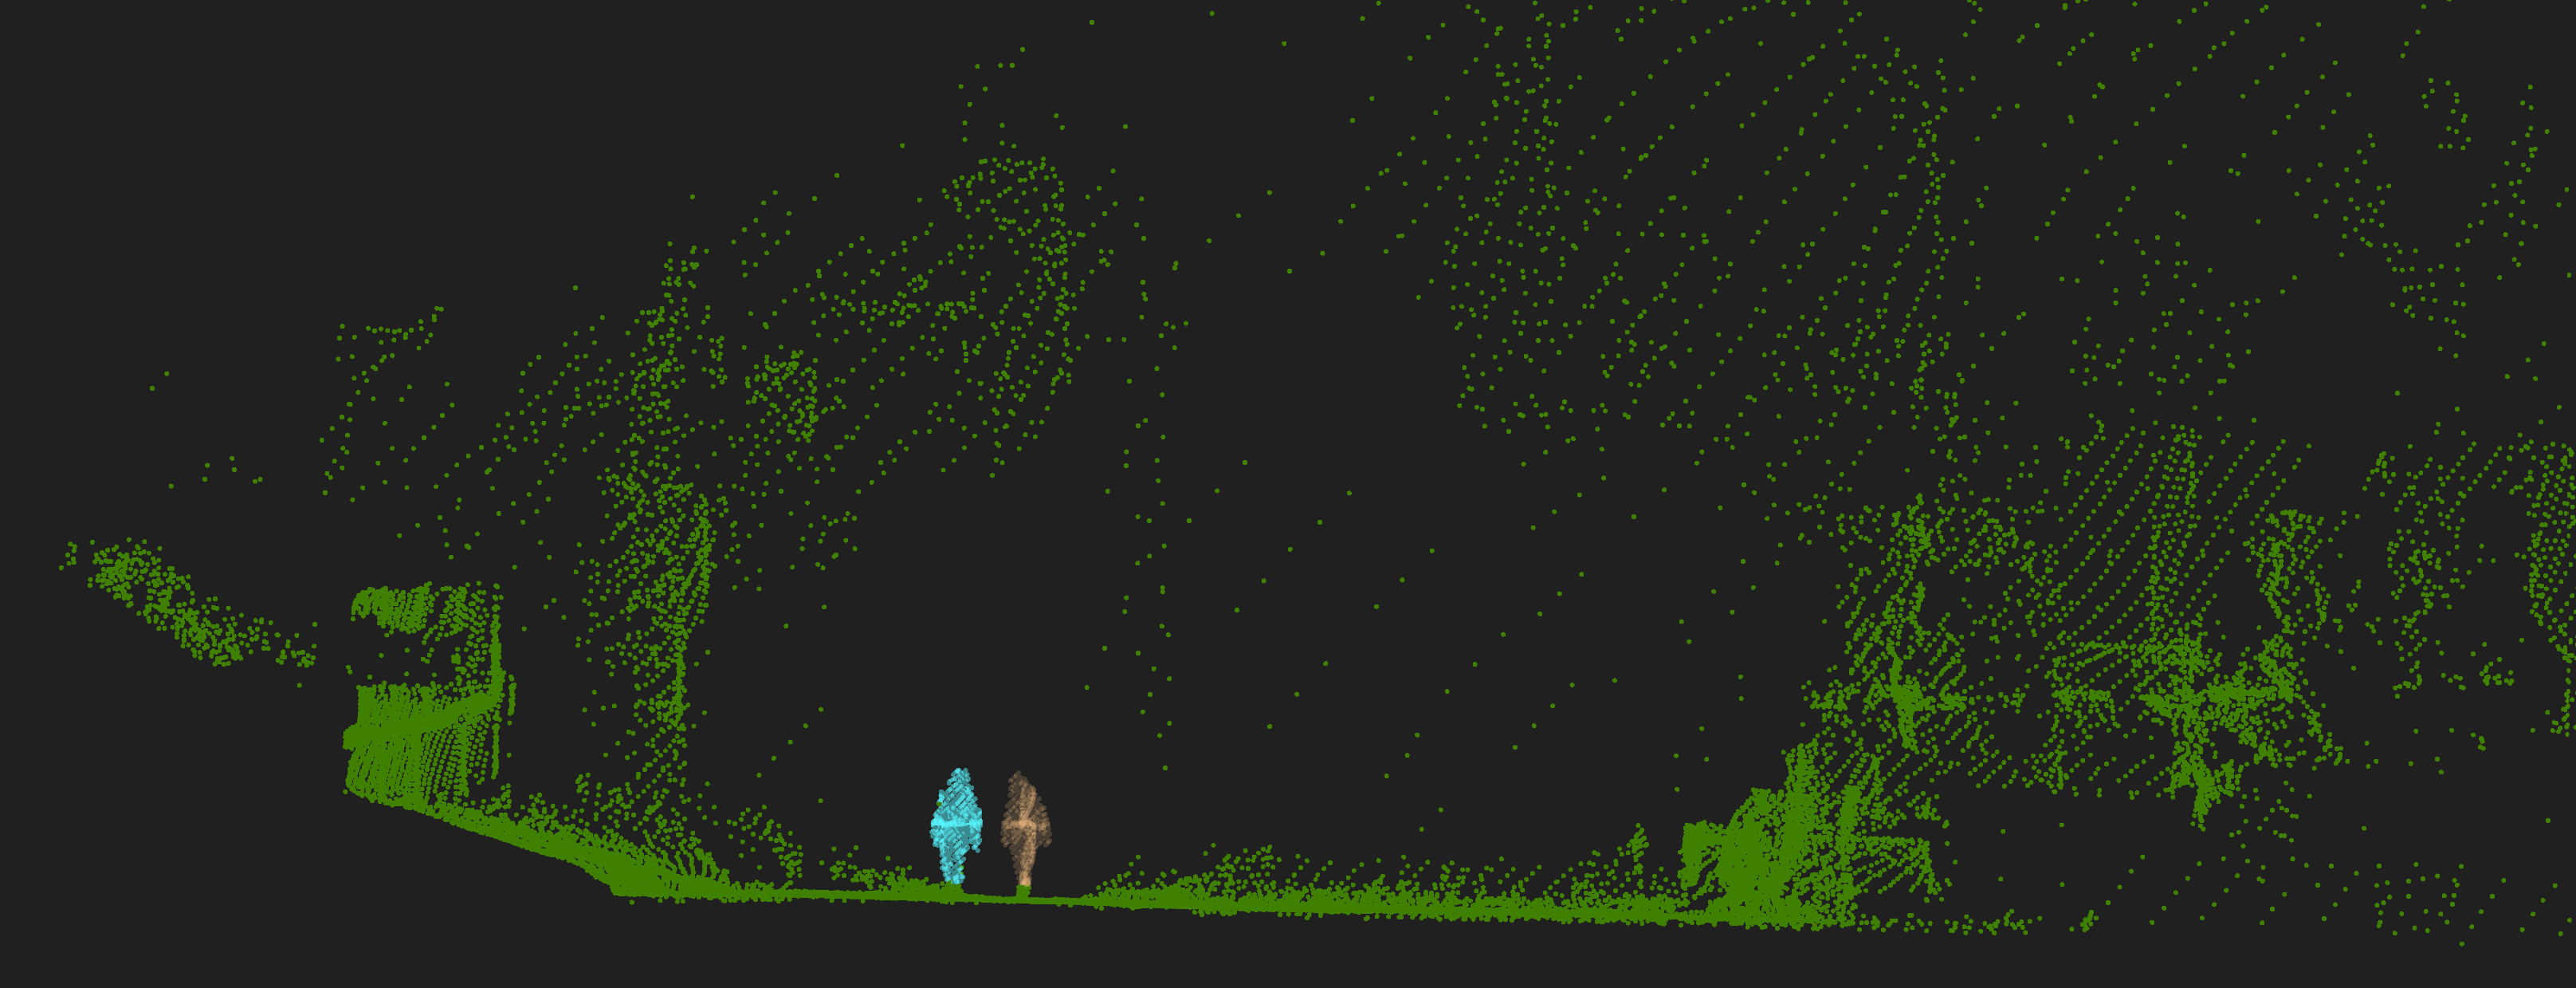
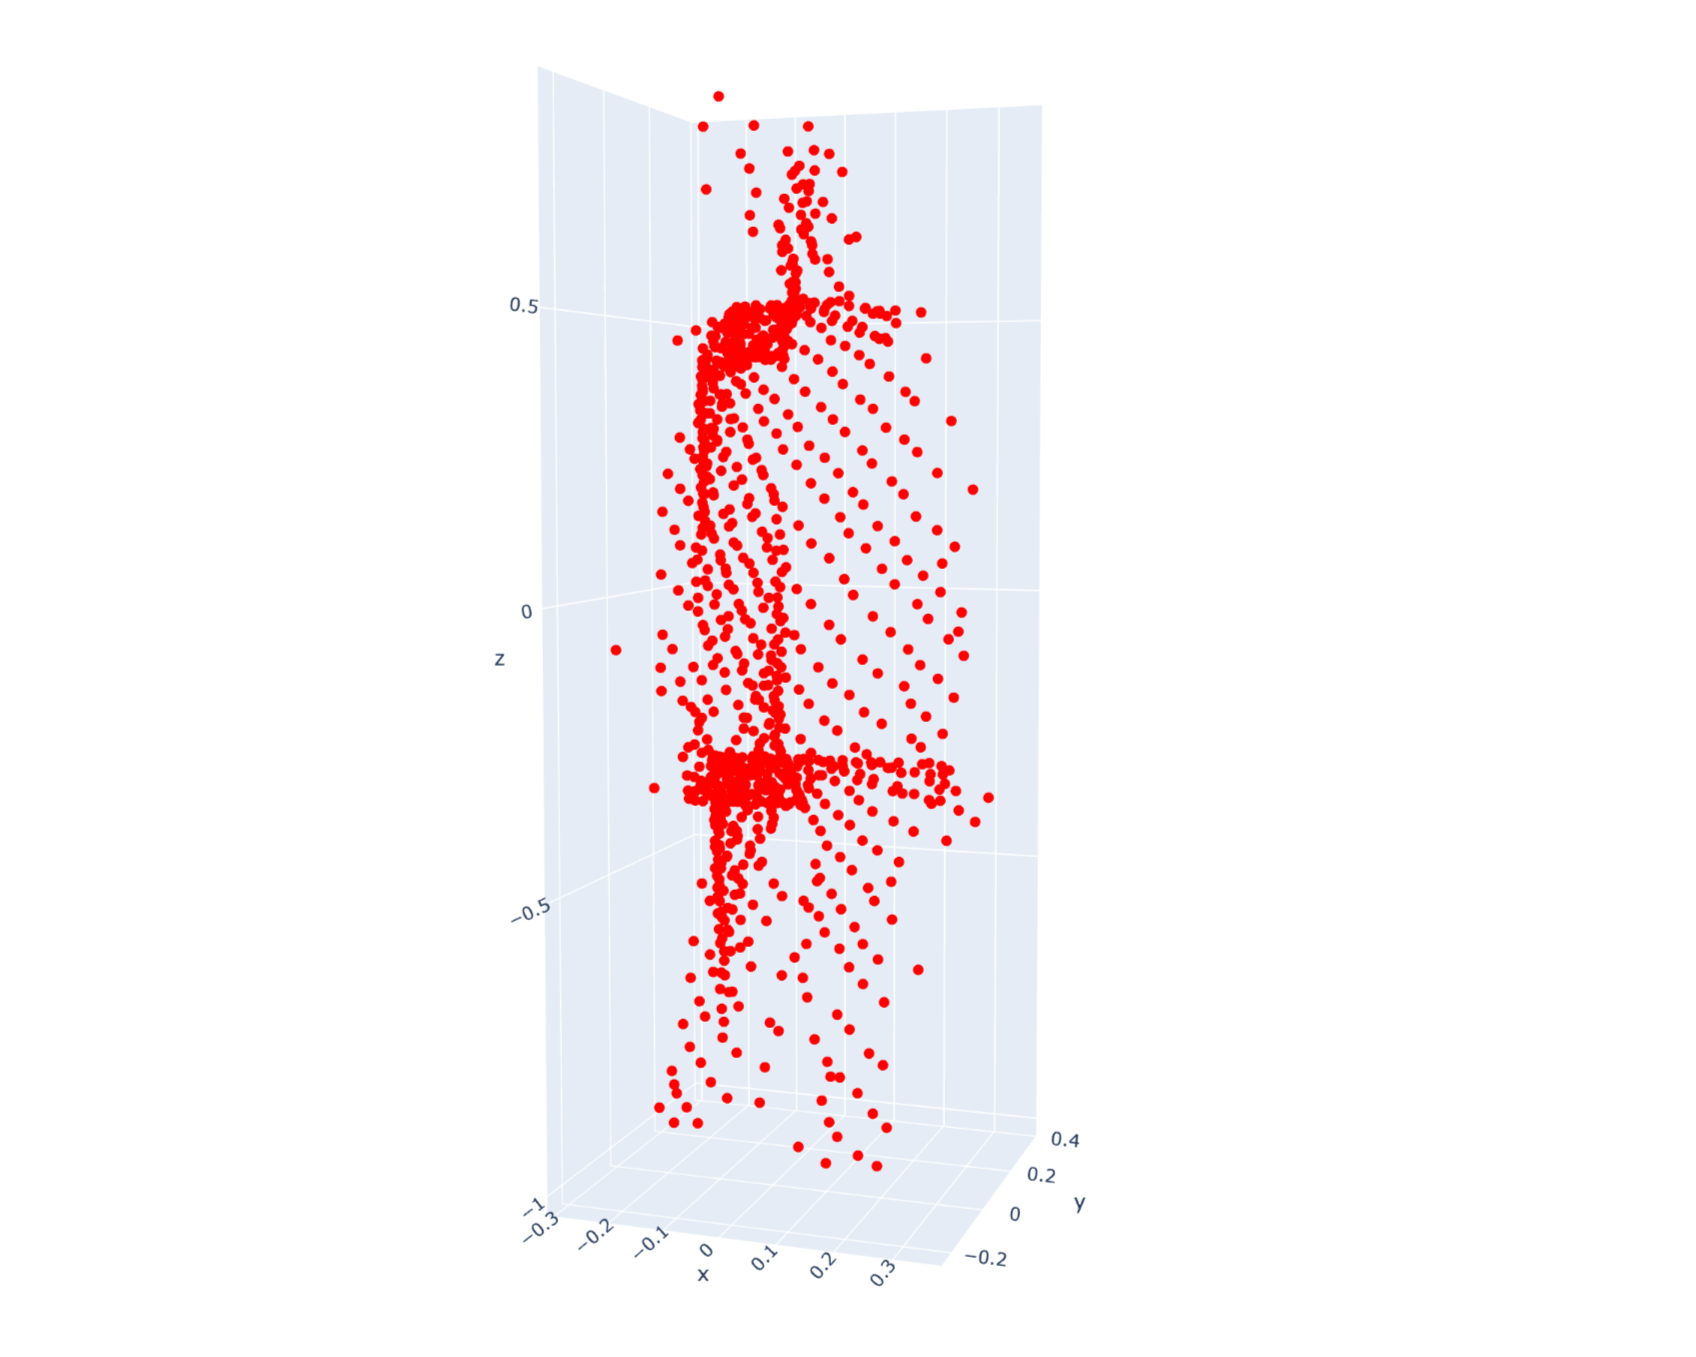
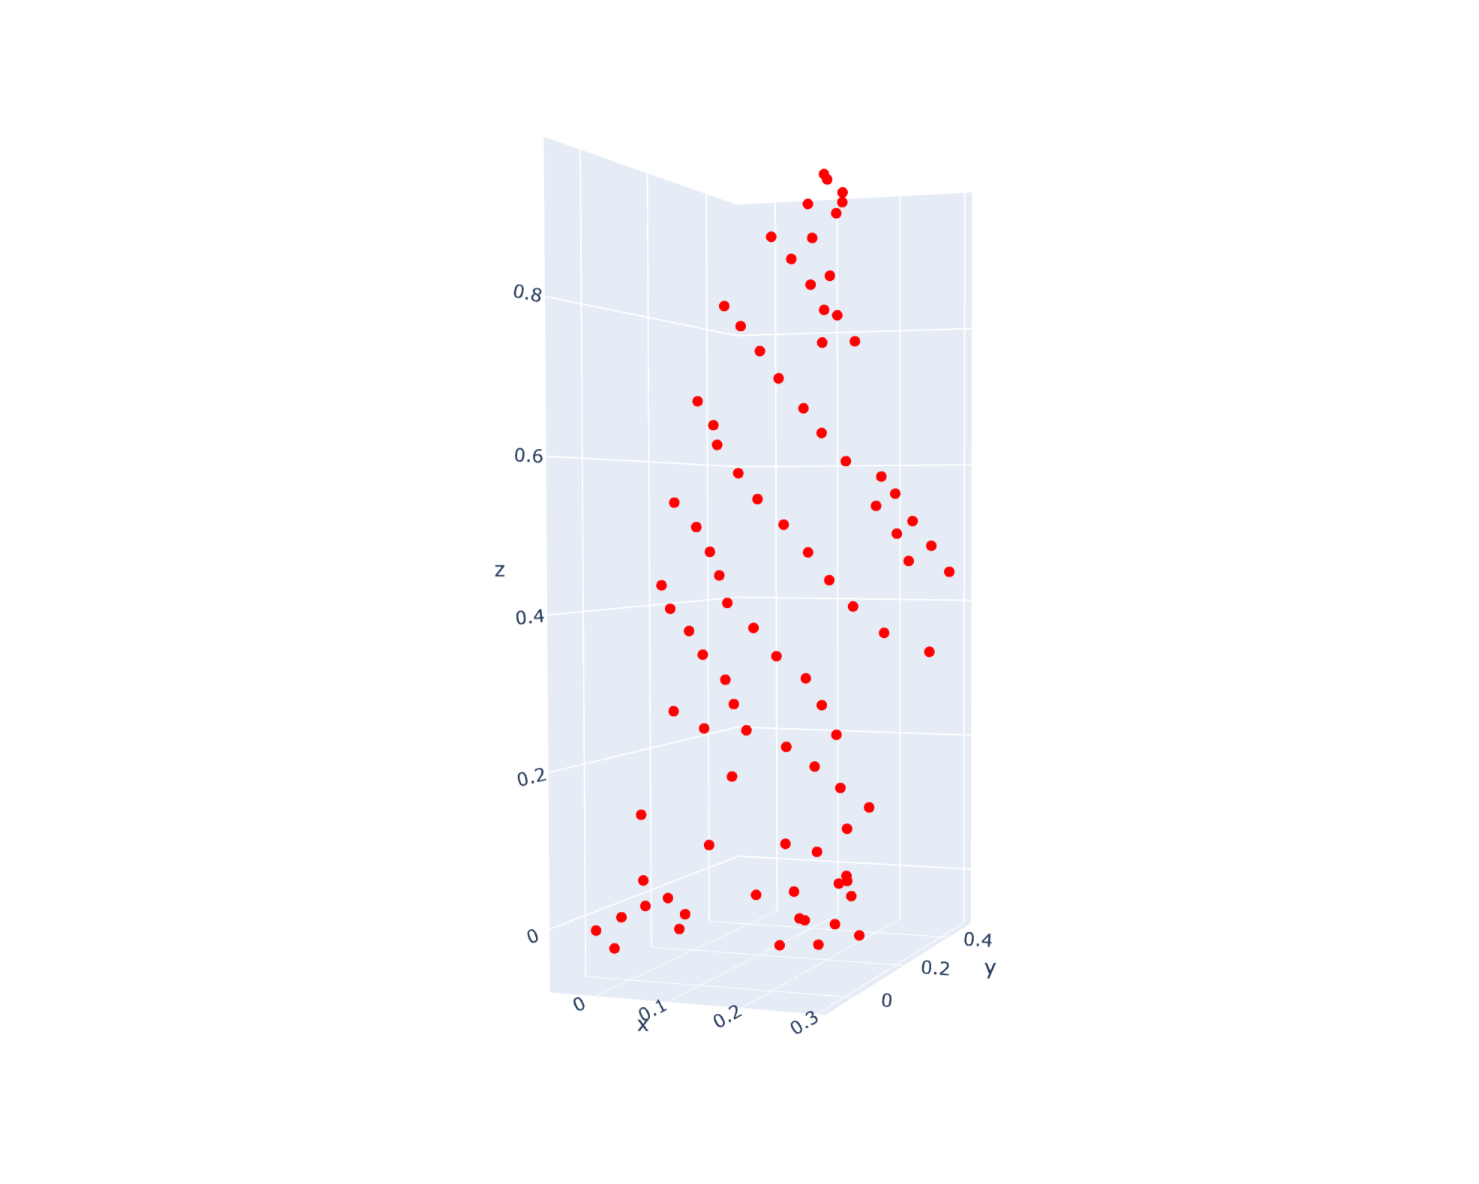
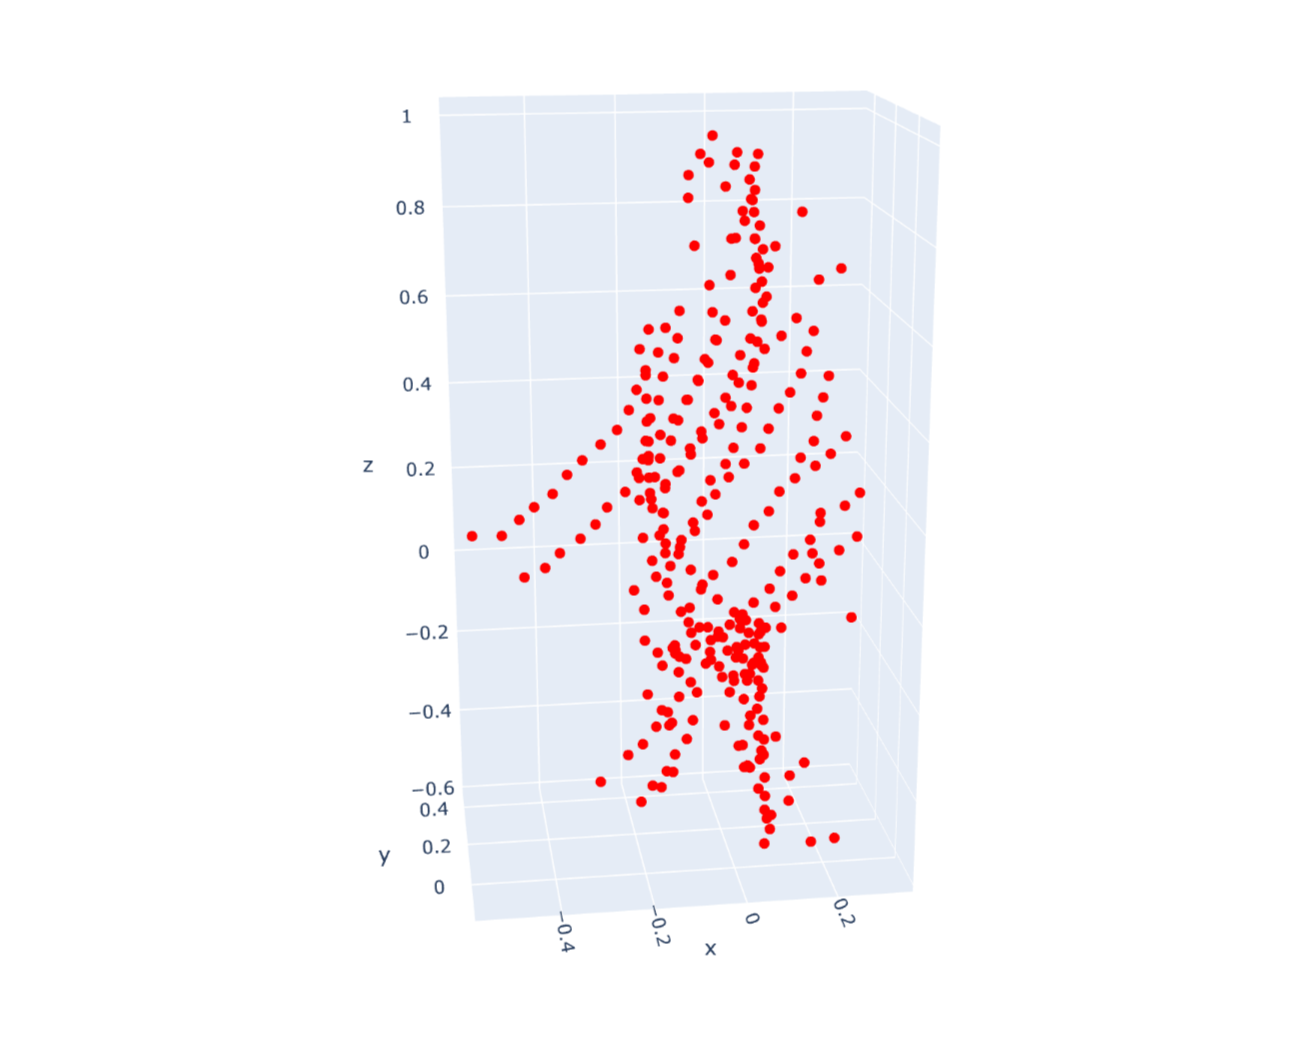
Six scenes, totaling 26,360 clusters and 11,682,401 points, were recorded using Cepton's VISTA-X sensors. These scenes were shot indoors and outdoors, capturing a variety of natural poses and occlusions. Data was uniformly sampled, zero centered, and normalized for preprocessing.
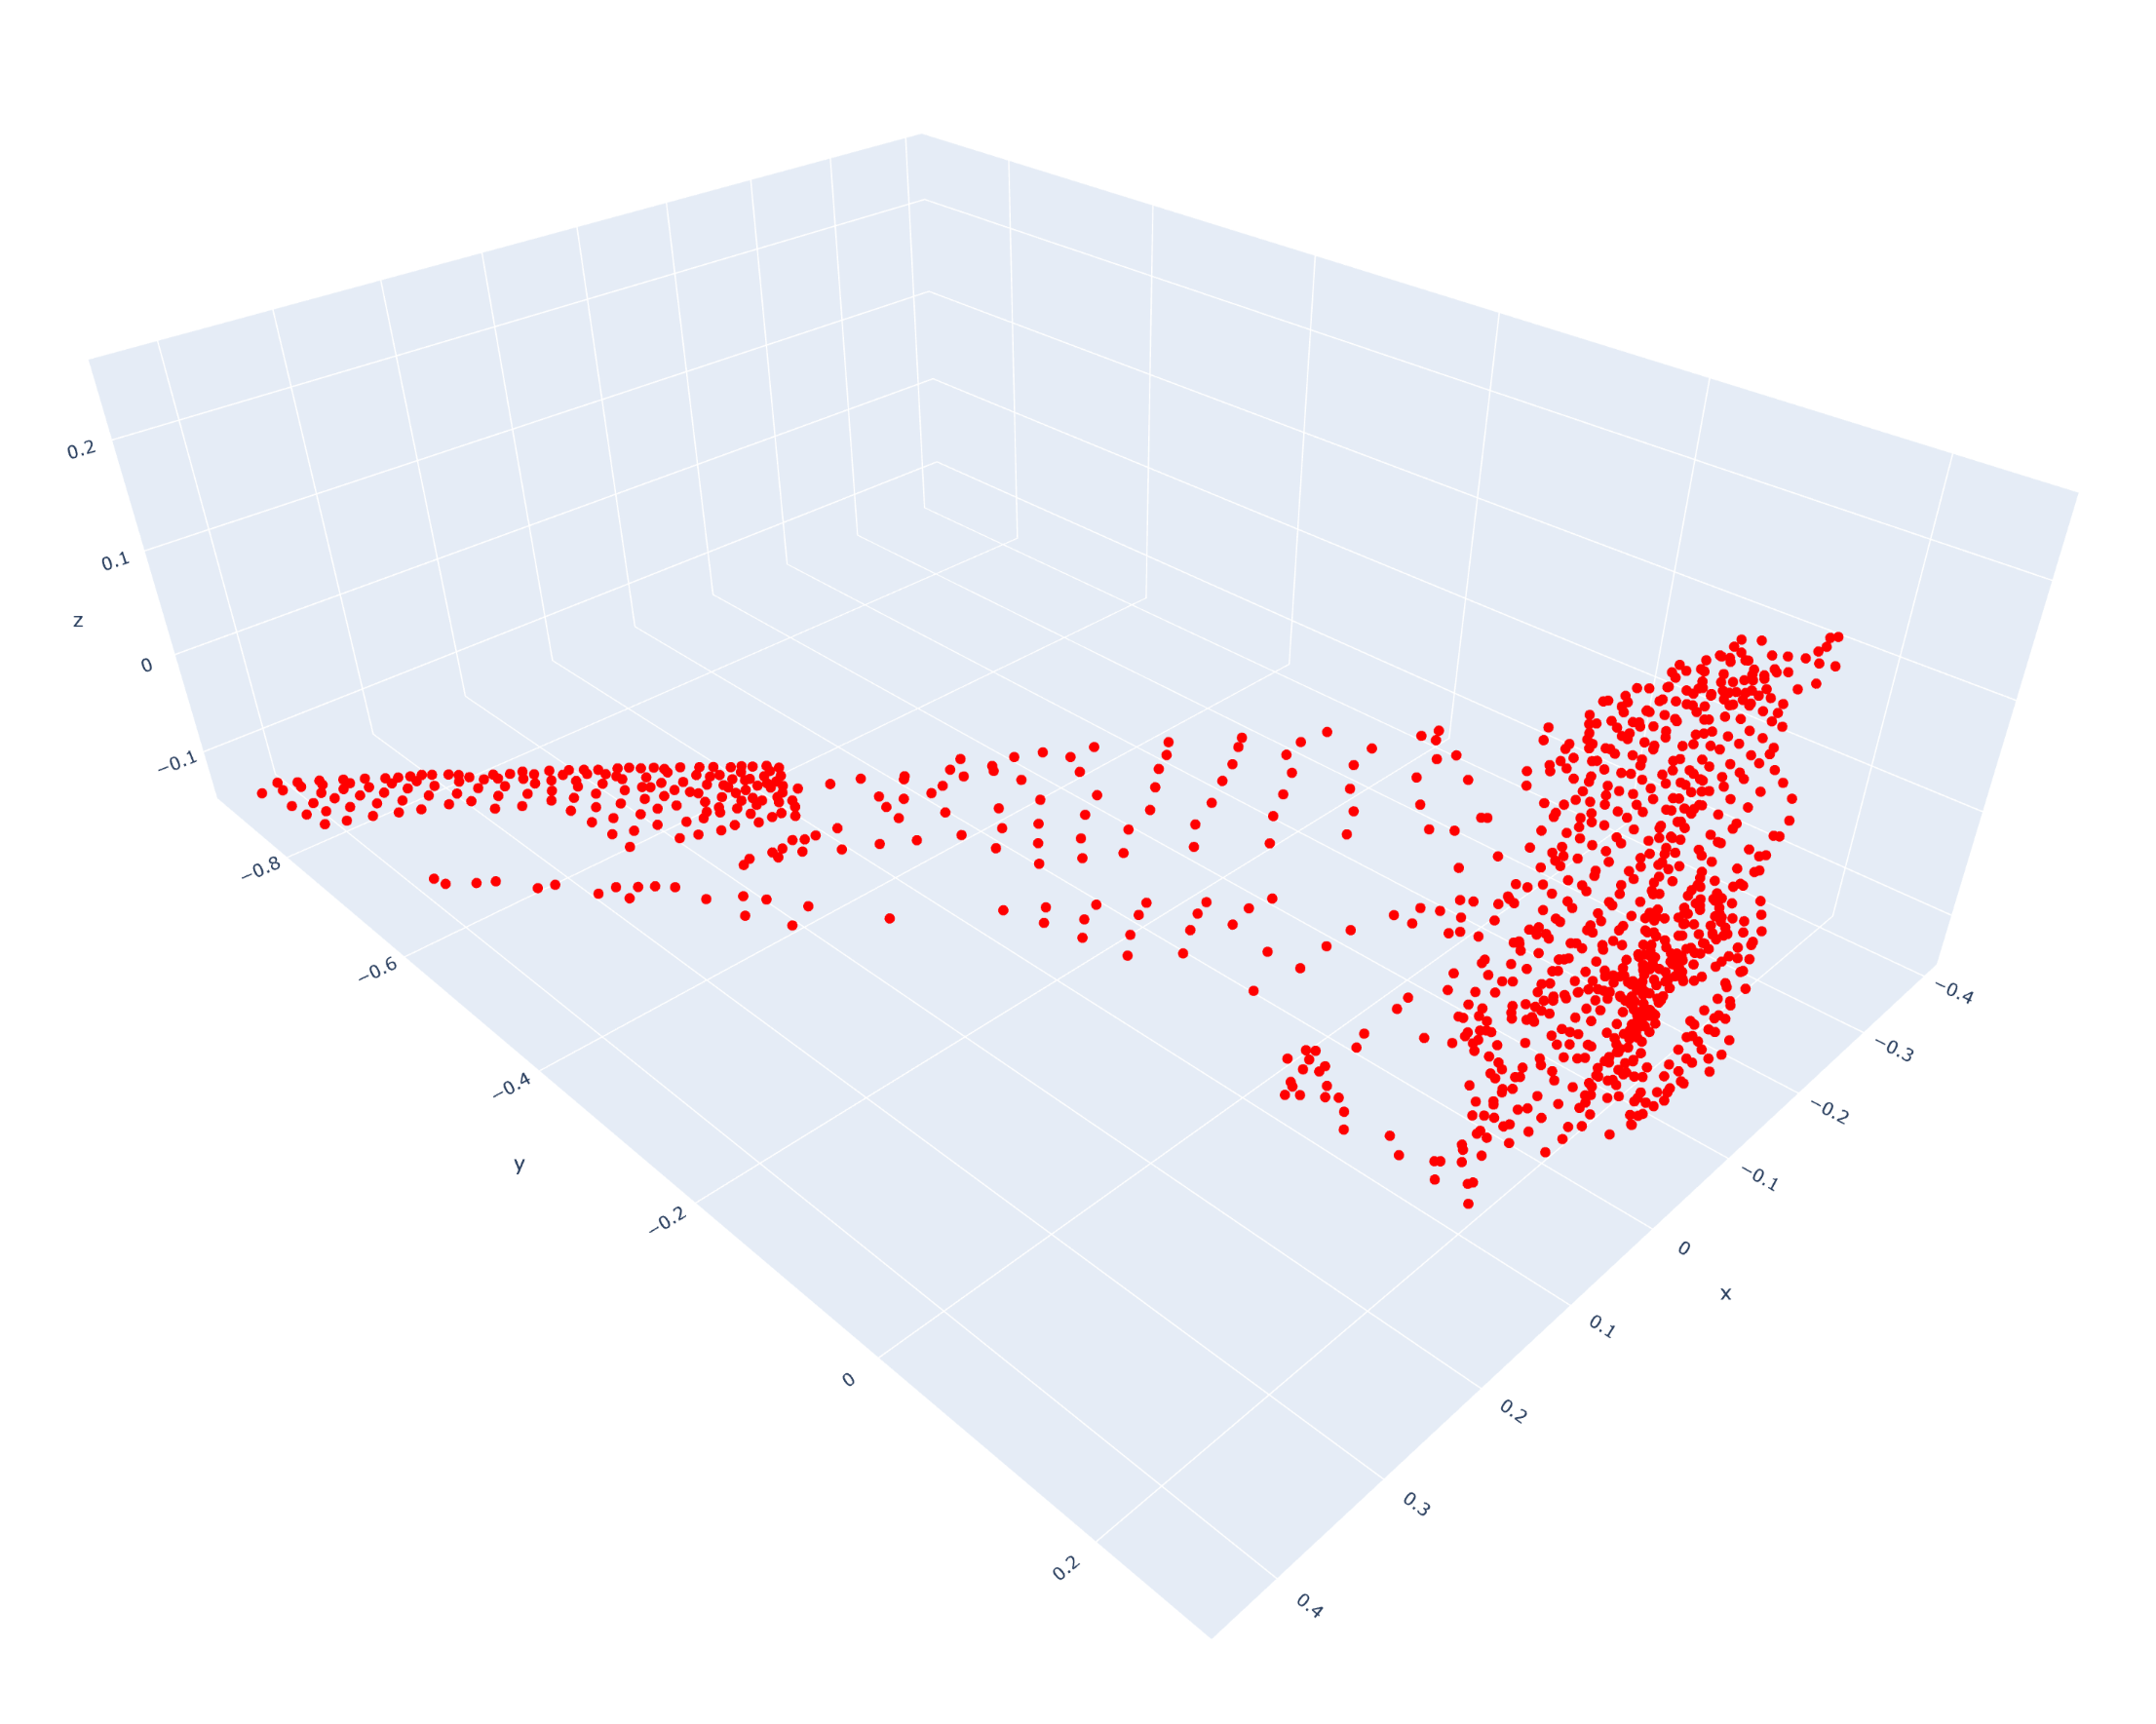
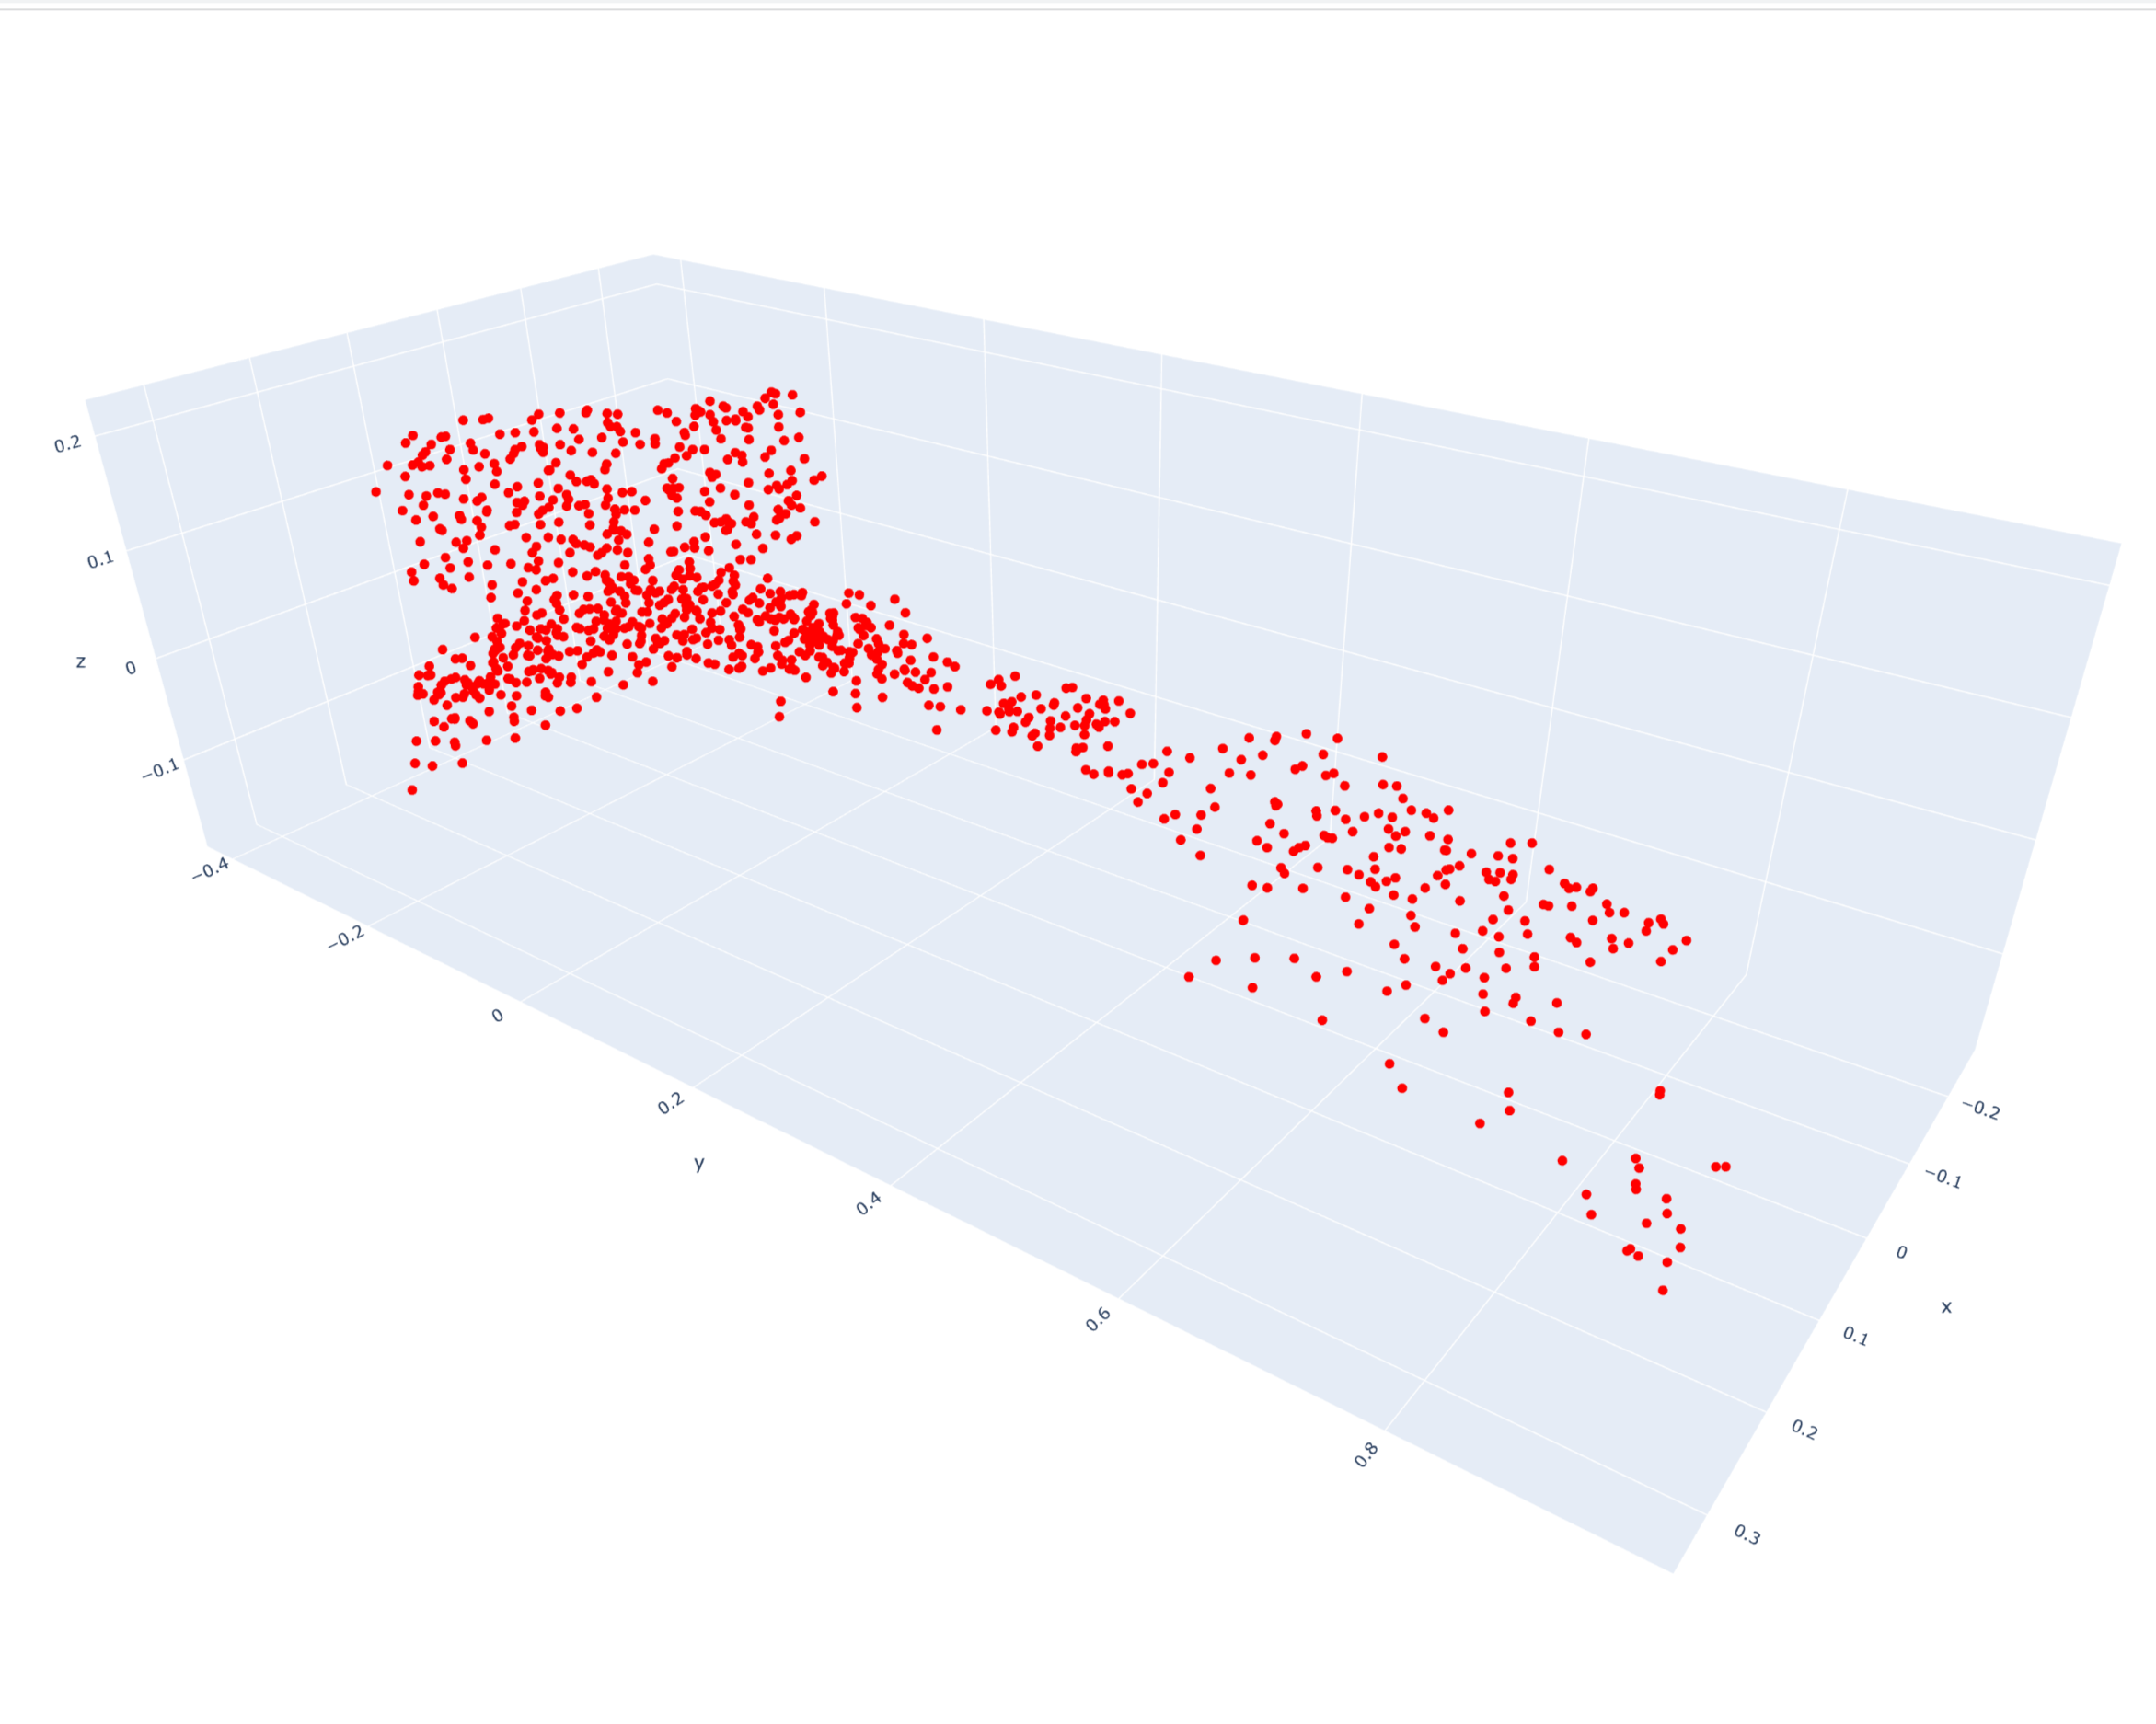
An 80/20 split was used to generate the training and testing sets. Some examples of the original point clouds are given below:
PointNet:
As one of the first DNN strategies for point-based point-cloud analysis, PointNet was chosen because it continues to be a highly efficient and effective baseline. Further, the architecture directly consumes point cloud data, as opposed to other models which must take depth maps as input. This network, often used for classification and segmentation tasks, forms the basis of our classifier. The original model described in its paper looks like:
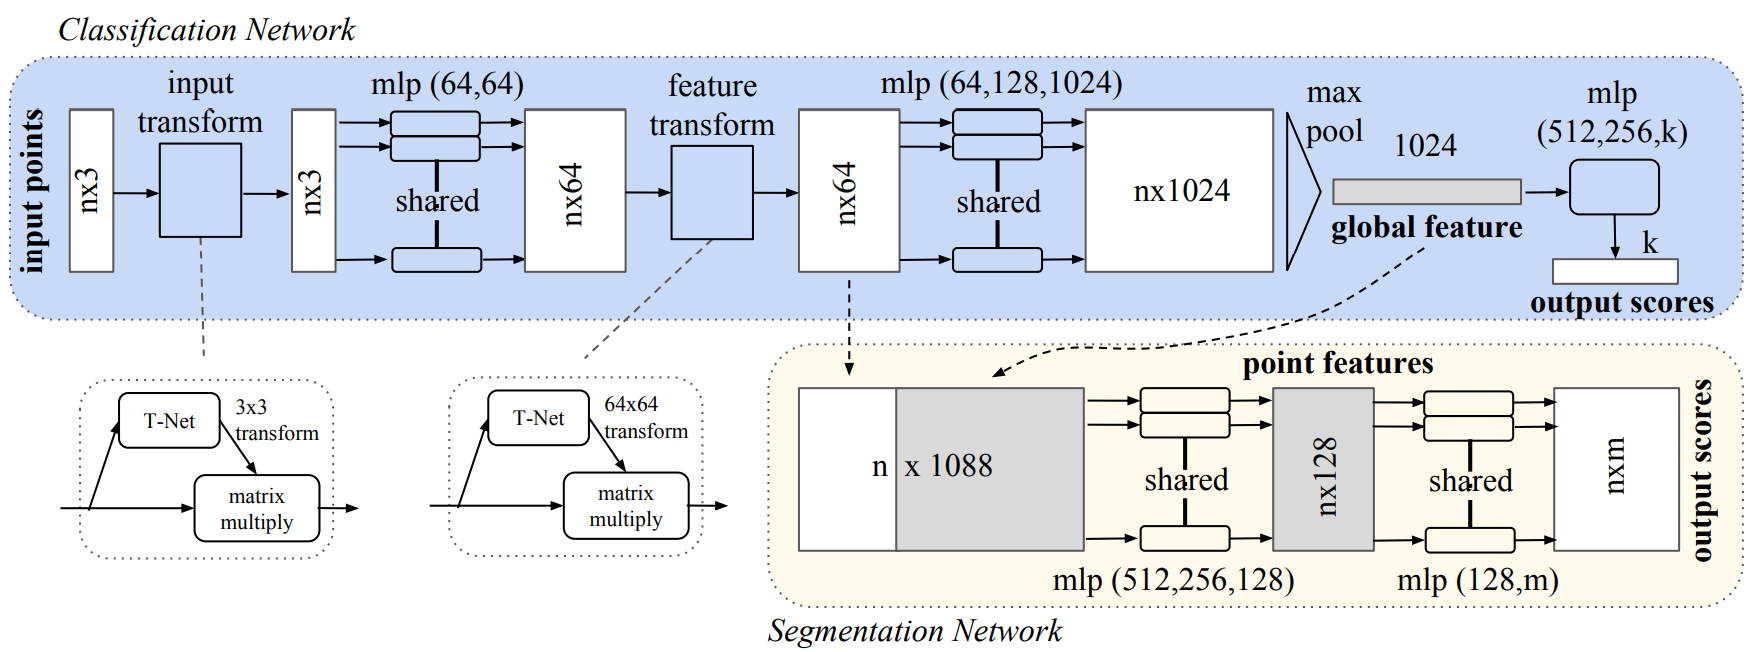 |
|---|
| Figure 2. PointNet Architecture |
In our initial experiments, the original model quickly overfit on our data. As a result, I compensated by cutting some layers and reducing the remaining ones. These modifications had the added bonus of making our classifier faster. The final model, after those changes, are shown in Figure 1.
Angular Resolution:
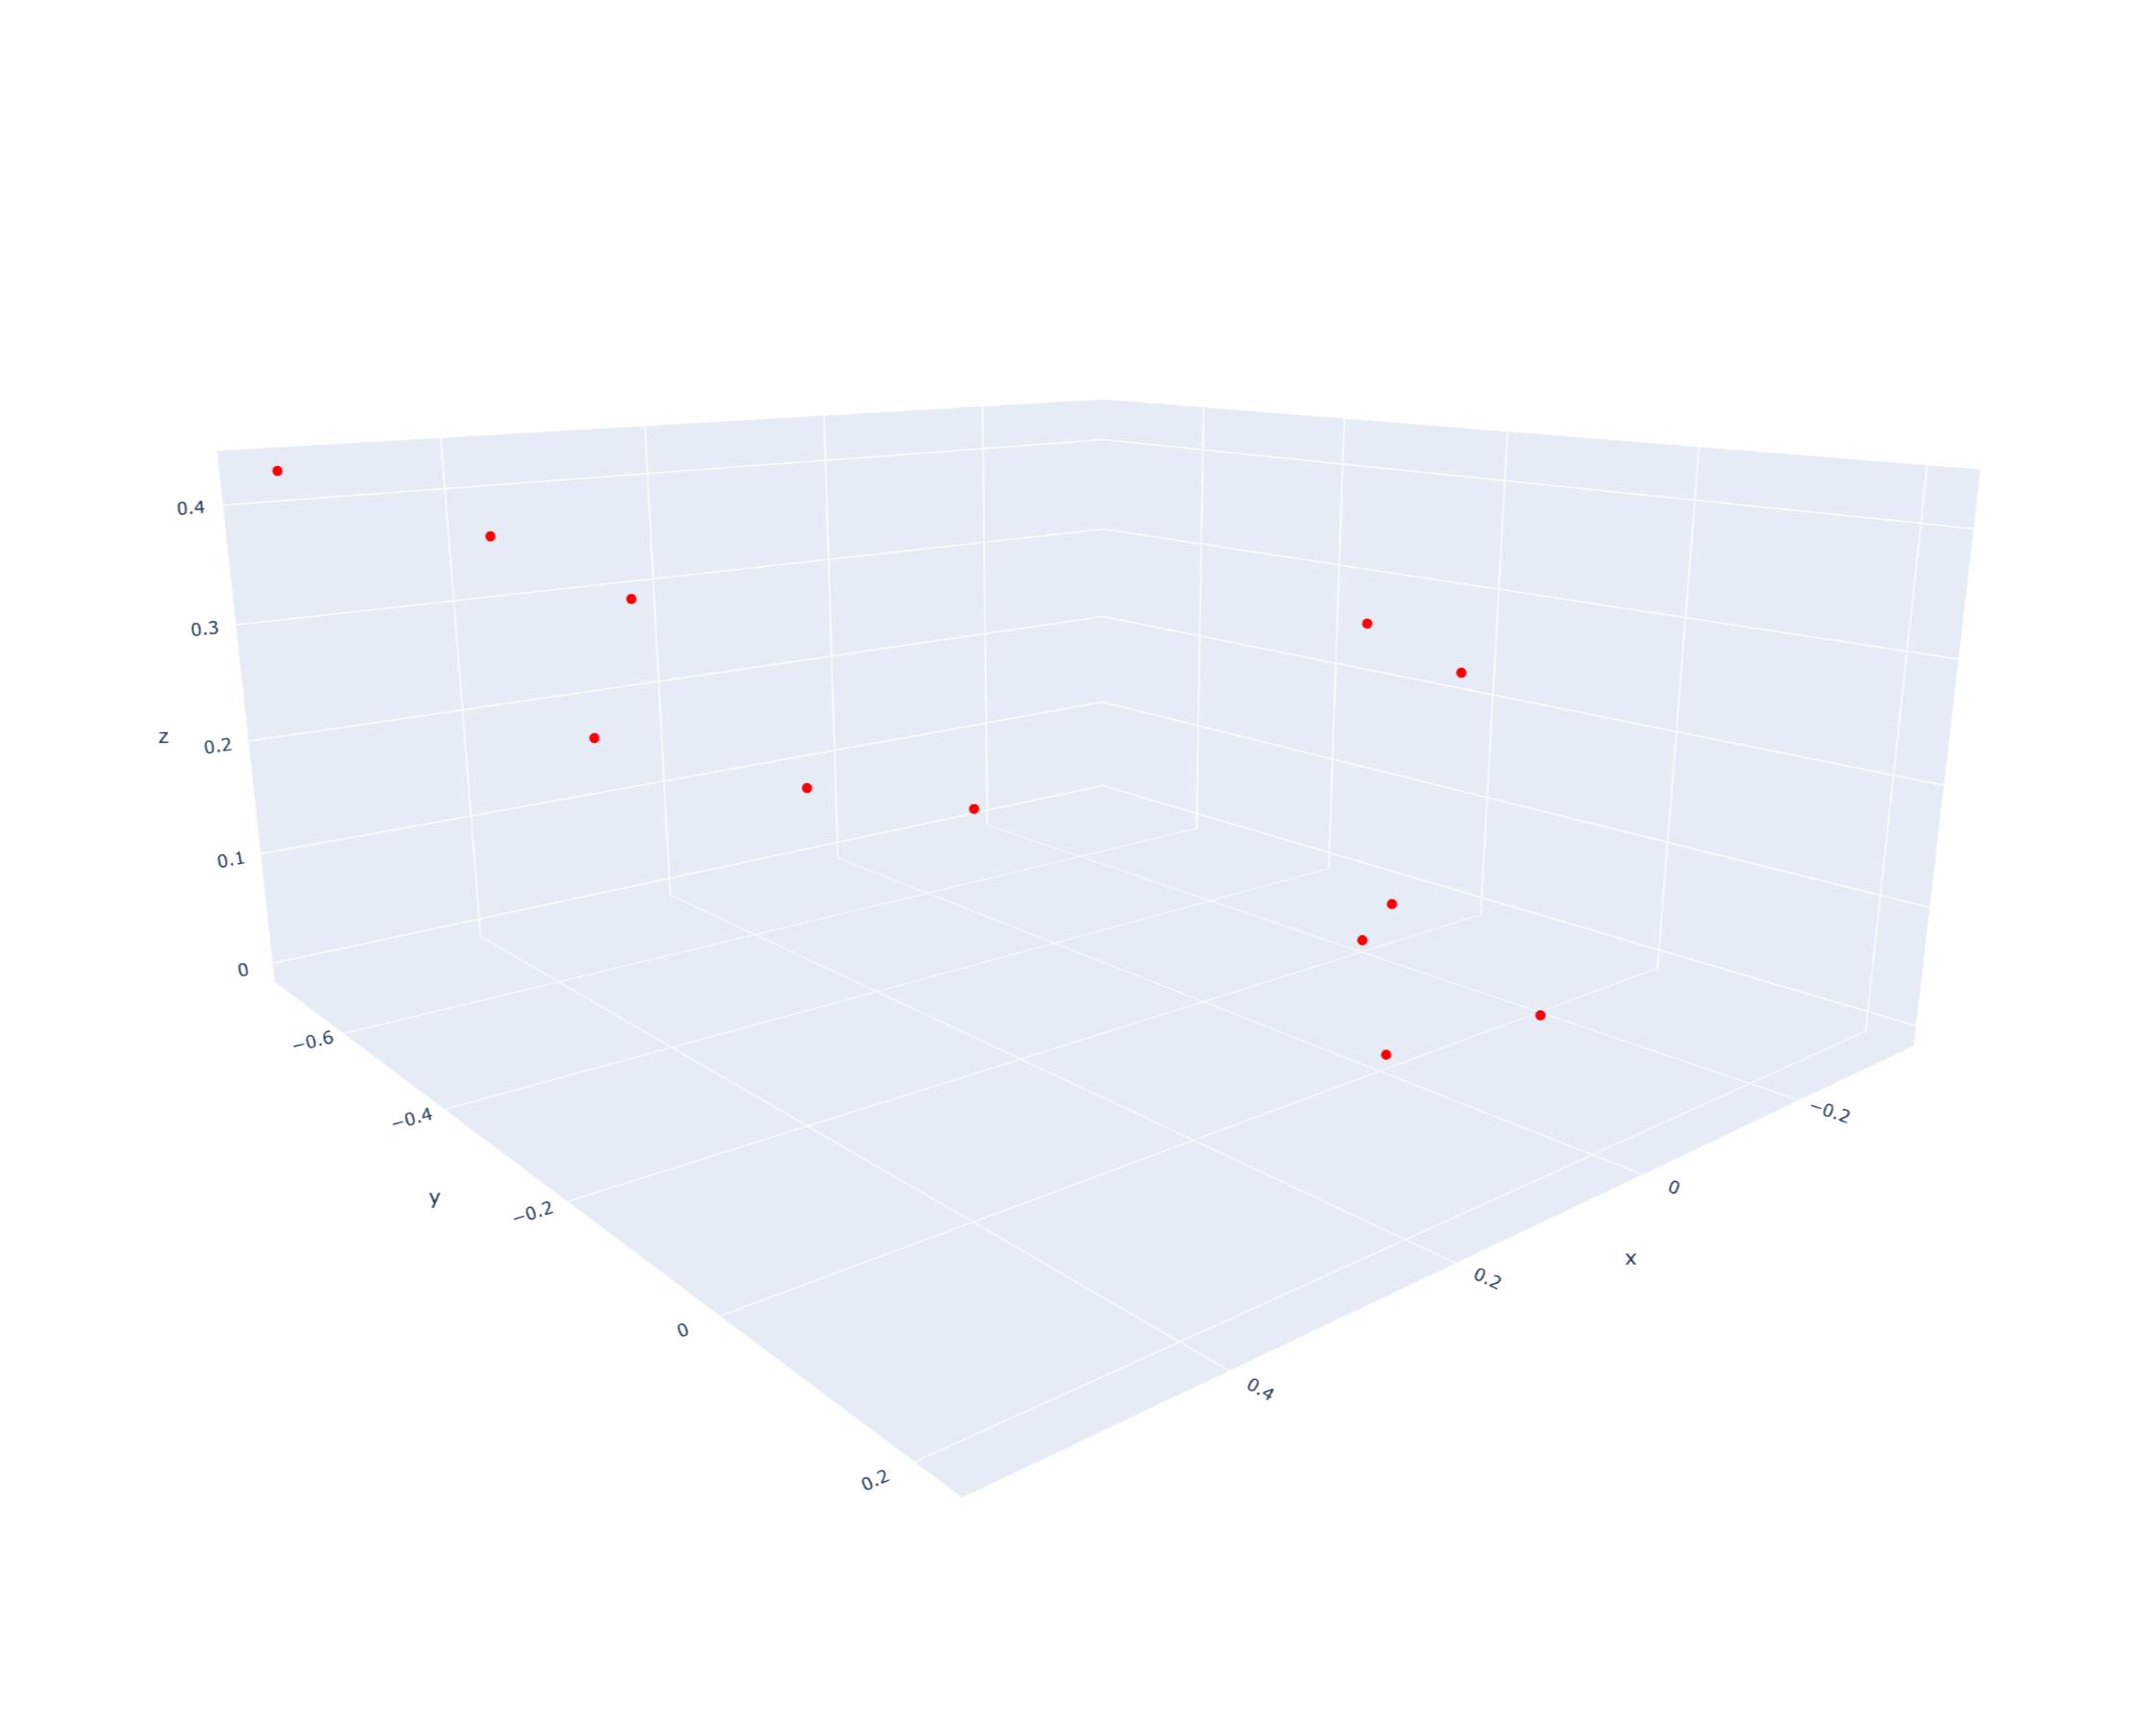
As subjects move further from the LIDAR, subjects' point clouds experience a natural drop in density, which means that classifiers should treat them differently. For example, a small point cloud right next to the sensor is probably not a person, but a small point cloud far away from it might be. The natural solution to addressing this issue seems to be to use distance as a feature. However, distance does not always correspond with density, as multi-sensor setups are frequently used in the real-world. The exact feature we are looking for is angular resolution.

We calculate angular resolution by dividing the scene into bins and counting the number of bins covered versus the number of points. This feature was added as an additional input to our model and is appended to the vector encoding the input point cloud. Our code for calculating angular resolution can be found here:
    def calculateAngularResolution(points, GRID_SIZE = 0.01):
        assert(len(points.shape)==2 and points.shape[1]==3)
        N = points.shape[0]

        min_x = np.min(points, axis = 0)[0]
        max_x = np.max(points, axis = 0)[0]

        set_bins = set()
        for x, y, z in points:
            bin_x = (x-min_x)//((max_x - min_x)/(1/GRID_SIZE))
            bin_y = y//GRID_SIZE
            set_bins.add((bin_x, bin_y))

        return N/len(set_bins)
Results:
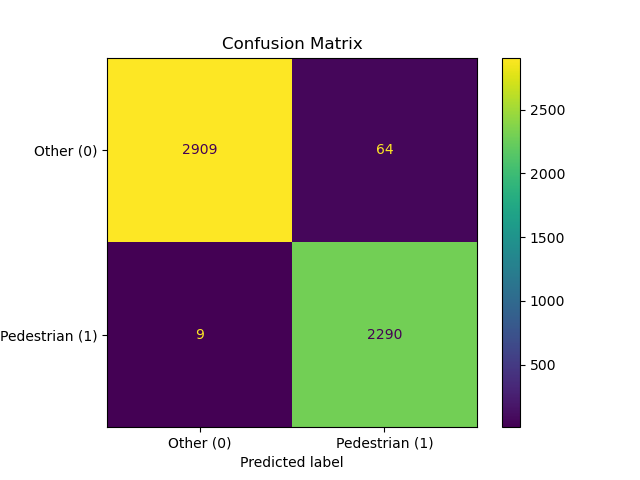
After reducing the model and adding angular resolution as a feature, the resulting model achieved 98.6% accuracy, with 99.6% recall and 97.3% precision. The confusion matrix, as well as the model results for previous samples, are below.
Future Directions:
Dataset
Though our dataset is relatively large, with respect to the number of clusters captured, it only represents six different scenes. Further, our training set and testing set are uniformly sampled from the dataset, resulting in relatively similar sets. Both of these factors, as well as our model's high accuracy, point towards over-fitting. In order to combat this, future works will be towards expanding the dataset and testing the classifier on never-before-seen data. In particular, efforts will be directed towards capturing strange poses and occlusions. Most pedestrian point clouds end up looking like cylindrical point clouds, so intentionally adding such challenging data should help the classifier learn more nuanced representations of humans.
Aside from collecting more data using our existing pipeline, one way of doing this might be to create a synthetic dataset. 3D models such as SMPL offer a parameterized representation of the human body 3. By projecting Cepton's LIDAR patterns onto these bodies, we can create a dataset that is rich in both poses and locations.
Model
Additionally, further experiments may experiment with the classifier architecture. PointNet was initially chosen as a highly efficient and effective baseline, but deeper neural networks have been subsequently proposed. For example, DGCNN proposes a novel operation called EdgeConv, which generates edge features to capture localized features and may thus perform better on our task 2. These experiments would have to be even more cautious about over-fitting, however, as they have orders of magnitude more parameters than PointNet.
Confidence Interval
Finally, in order to improve the applicability of the classifier in tracking pipelines, we can also considering calculating a confidence interval for each inference. This comprises of an upper bound and lower bound around the estimate, which would give us an additional glimpse into the uncertainty of the reported likelihoods 4.
References
1. PointNet: Deep Learning on Point Sets for 3D Classification and Segmentation
2. Dynamic Graph CNN for Learning on Point Clouds
4. Creating Confidence Intervals for Machine Learning Classifiers