Lyft Dataset Investigation

Introduction
With Cepton Inc.'s Lidar sensor, you can collect high-resolution point cloud data in real-time as below.

As you can see, it captures pedestrians and cars. If you take a close look, you can also see how fast the cars are moving or even how tall the pedestrians are. Our Lidar provides various informative data to us.
However, this data is only comprehensible to us, humans, not to computers. That's where our team, the Perception team, comes into play. Our team's goal is to figure out what information we can extract from the point cloud data captured by our Lidar.
In this post, I go over a public dataset, Lyft 3D Object Detection for Autonomous Vehicles, release from Lyft to see what information they handle.
Purpose
Find out the basic usage of data properties of Lyft 3D Object Detection for Autonomous Vehicles.
Procedures and Results
Downloading Data
First thing first, go to the page of Lyft 3D Object Detection for Autonomous Vehicles and click Download All located at the bottom right of the page. Here, I note that the total data size is around 90GB. Make sure you have enough disk space in your environment.
Read and Write Data
With the 3d-object-detection-for-autonomous-vehicles directory ready, let's read the dataset.
Kindly enough, Lyft provides their own SDK in Python, lyft_dataset_sdk to play with the dataset.
The following code is to read the dataset and export the point cloud data and the bounding boxes data to JSON files.
(Note: Strangely, you need to rename directories for training data as follows: train_images -> images, train_lidar -> lidar, train_maps -> maps, and train_data -> data)
from lyft_dataset_sdk.lyftdataset import LyftDataset
from lyft_dataset_sdk.utils.geometry_utils import (
    BoxVisibility,
)
from lyft_dataset_sdk.utils.data_classes import LidarPointCloud
import json

def generate_next_token(scene):
    scene = lyft_dataset.scene[scene]
    sample_token = scene["first_sample_token"]
    sample_record = lyft_dataset.get("sample", sample_token)

    while sample_record["next"]:
        sample_token = sample_record["next"]
        sample_record = lyft_dataset.get("sample", sample_token)
        yield sample_token

DATA_PATH = "./3d-object-detection-for-autonomous-vehicles/"
lyft_dataset = LyftDataset(data_path=DATA_PATH, json_path=DATA_PATH + "data")

for scene_id in range(len(lyft_dataset.scene)):
    for frame, sample_token in enumerate(generate_next_token(scene_id)):
        print(f"Processing scene {scene_id}, frame {frame}")
        sample = lyft_dataset.get("sample", sample_token)
        sd_record = lyft_dataset.get("sample_data", sample["data"]["LIDAR_TOP"])

        _, boxes, _ = lyft_dataset.get_sample_data(
            sample["data"]["LIDAR_TOP"],
            box_vis_level=BoxVisibility.ANY,
            flat_vehicle_coordinates=False,
        )

        pc, _ = LidarPointCloud.from_file_multisweep(
            lyft_dataset,
            lyft_dataset.get("sample", sd_record["sample_token"]),
            sd_record["channel"],
            "LIDAR_TOP",
            num_sweeps=5,
        )

        points = pc.points[:3, :].T.tolist()

        box_data = [{"corners": box.corners().T.tolist(), "label": box.name} for box in boxes]

        data = {
            "points": points,
            "boxes": box_data,
        }
        with open(f"exported/scene_{scene_id}_frame_{frame}.json", "w") as f:
            json.dump(data, f)
Here I visualize one of the scenes on our Cepton Viewer. It seems like one scene is about 6-seconds long. This scene particularly is captured by a car taking a left turn at an intersection.
What objects are in it?
To know more about the dataset, let's see what types of objects it contains. Following is the code to show the demographics of the objects in the whole dataset.
# Overlapped code omitted for brevity.  ...

import matplotlib.pyplot as plt
from collections import Counter

# Overlapped code omitted for brevity.  ...
all_box_names = []
for scene_id in range(len(lyft_dataset.scene)):
    for frame, sample_token in enumerate(generate_next_token(scene_id)):
        print(f"Processing scene {scene_id}, frame {frame}")
        sample = lyft_dataset.get("sample", sample_token)

        _, boxes, _ = lyft_dataset.get_sample_data(
            sample["data"]["LIDAR_TOP"],
            box_vis_level=BoxVisibility.ANY,
            flat_vehicle_coordinates=False,
        )

        all_box_names.extend([box.name for box in boxes])

# Create the histogram.
counts = Counter(all_box_names)
labels, values = zip(*counts.items())
plt.figure(figsize=(10,5))
plt.bar(labels, values)
plt.xlabel('Object Names')
plt.ylabel('Count')
plt.title('Distribution of Object Names')
plt.xticks(rotation=90)
plt.tight_layout()
plt.show()
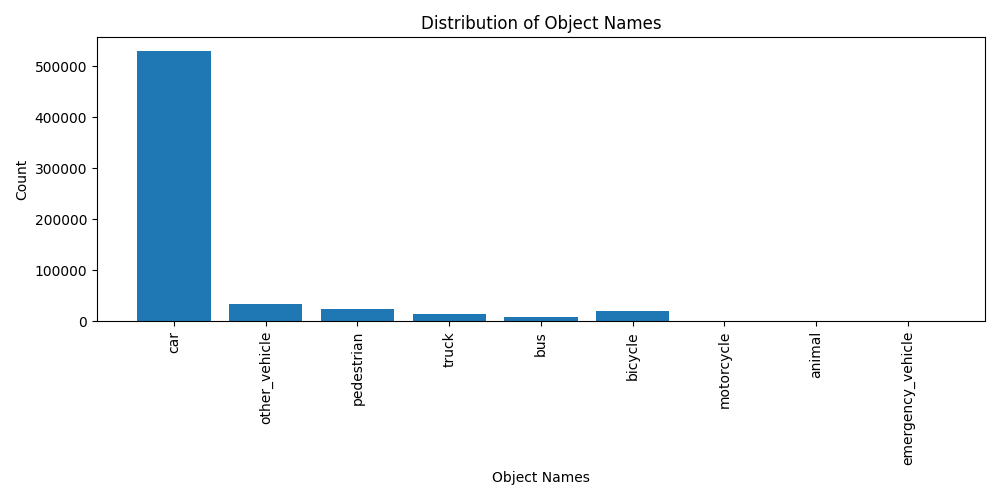
As it shows, the large majority consists of cars. Unexpectedly, this dataset has a small population of pedestrians because detecting people tends to be a critical task in many perception applications.
Conclusion
In this post, I briefly investigated the Lyft 3D Object Detection for Autonomous Vehicles. The dataset was very handy to use, thanks to the SDK provided by Lyft. But it is important for us to be aware that there is a large imbalance between the population of cars and pedestrians.
References
About the author: Hikaru Ibayashi is a Software Engineer at Cepton Inc. Perception team. He holds a Ph.D. degree in Computer Science from the University of Southern California, where his research focused on the foundation of deep neural networks and physic-informed machine learning.